Detailed portfolio analysis through the lens of risk
The beauty of the Risk Number® is how it empowers investors to stay the course during the short term so they don’t lose sight of the long term. But what happens when your analytical clients need more detailed analysis or reporting?
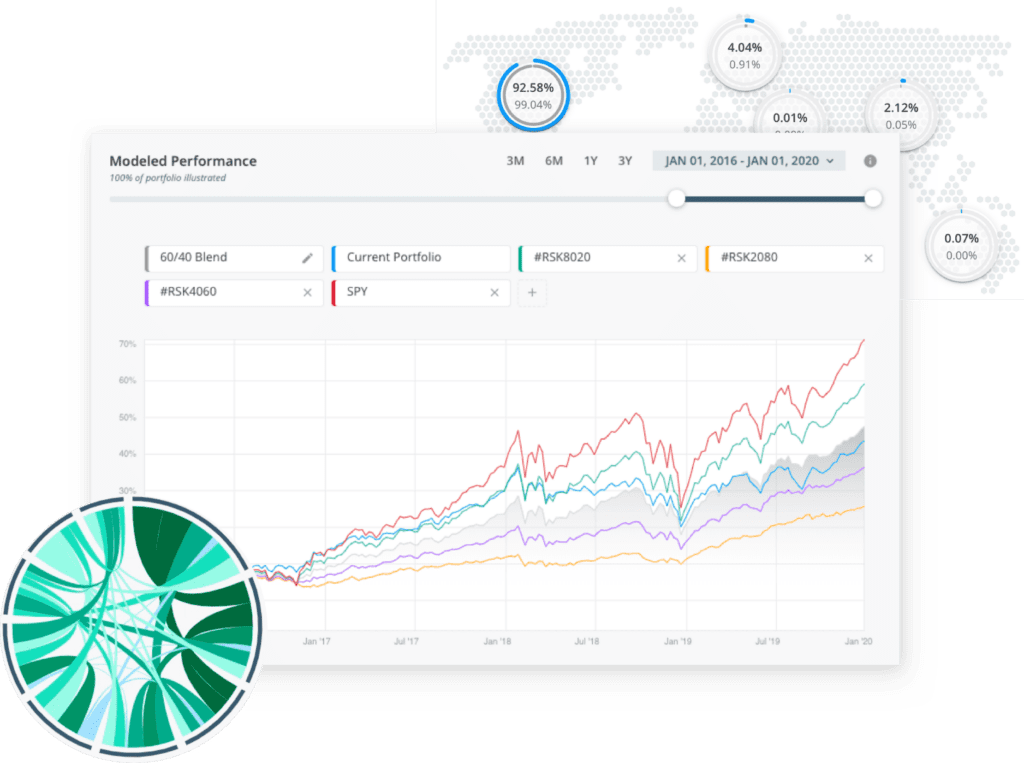
Detailed Portfolio Stats is data analytics taken to the next level. With a variety of tools ranging from modeled performance, sector breakdowns, risk/reward scatter plots, and data correlation, it’s the most effective way to analyze a portfolio through the lens of risk.

Better data, better decisions
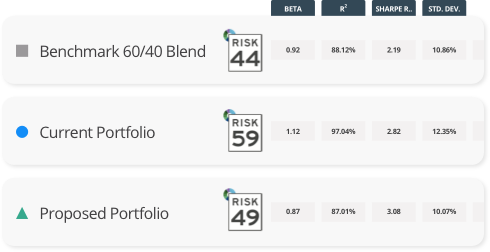
Powerful portfolio analytics help you analyze the data that matters so you can make informed decisions. From Sharpe Ratios, Beta, Drawdown, and everything in-between, Stats has you covered (TI-83 calculator not required).
Want to test a different mutual fund or ETF in a client portfolio? No problem — with Portfolio Sandbox, you can easily swap stocks or funds to test potential changes to client portfolios and immediately see the impact before implementing.
Every tool at your disposal.
It’s never been easier to set expectations with clients, prove your fiduciary care, and grow your business.
 Nitrogen Elite